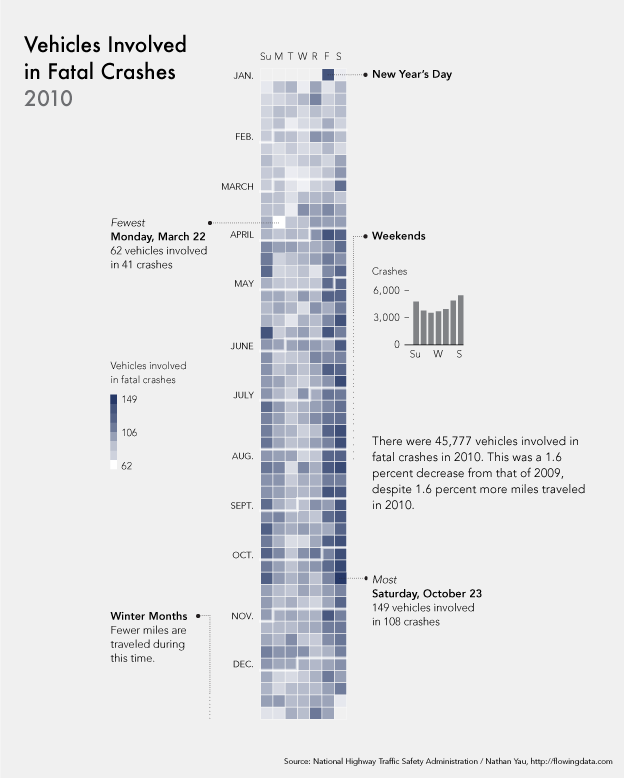
This piece for example. I like the way the colours represent the number of people involved in fatal crashes but then also there is sections coming from this with more information. The ideas of this i could evolve for my totem pole section, place the pole down the middle with the information layed out around it.

I like the way this info-graphic uses the illustrations to create a timeline of both text and image to help get the information across. This is something i will more than likely be doing as appose to graphs and stats.

Again in this one, simple pictograms of the different dangers in the house. really like the colour scheme and it all fits together nicely to get the message across.


Also, a change in colour for the different sections which creates a nice division between pages or segments of this piece. A good idea.

I like the variation between the simple pictograms and diagrams to the large circles to represent the most serious outbreaks. This is a really successful piece.

Like the idea of the 3d element bringing all the pieces together. This is something i could look at with the structure and different elements of the totem pole or maybe something else within my designs.

Leave your comment